XRP Price Prediction: Mastering Market Resistance Strategies
Join me as we analyze XRP's price movements and resistance levels. Let's uncover trading strategies to navigate today's crypto market together.
The cryptocurrency market is witnessing significant volatility, and XRP is no exception. With recent price fluctuations and a broad spectrum of sentiment, analyzing XRP's market dynamics is crucial for traders like you who are looking to capitalize on opportunities. Understanding resistance levels, especially during these turbulent times, can greatly impact your trading strategies.
In this article, we’ll dissect XRP’s recent performance, evaluate key resistance levels, and compare its trajectory with popular meme coins. Plus, we’ll explore actionable trading strategies based on technical indicators, current market sentiment, and community engagement.

🎯 KEY INSIGHT
Understanding resistance levels is key for effective trading.
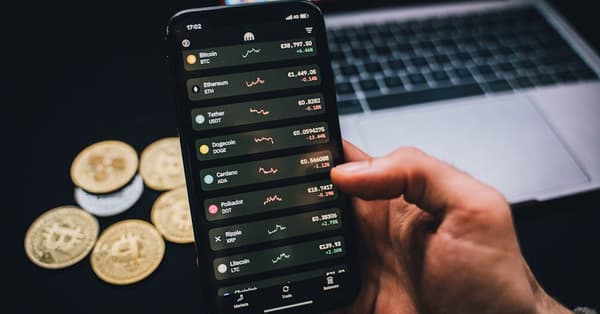
Over the past month, XRP has seen a notable uptick, reaching a high of $3.00 after an impressive 340% pump. However, fluctuations between $2.50 and $2.75 highlight the coin's volatility. Overall market sentiment has been cautiously optimistic, especially following some recent favorable regulatory news.
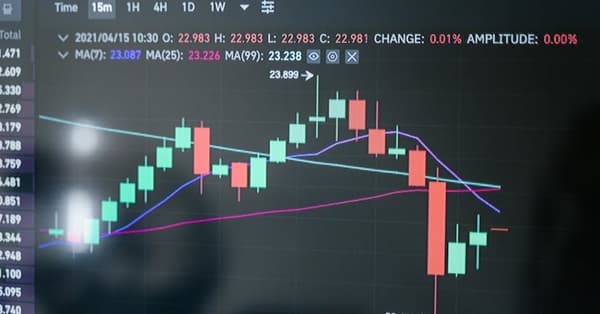
Resistance levels signify price points where selling interest is historically strong. For XRP, the pivotal $2.50 resistance level has proved significant, with previous tests leading to pullbacks. Analyzing historical data, it’s clear that XRP has faced repeated challenges at this price point, making it essential for traders like you to monitor closely.
Moving averages serve as vital indicators of trends. The 50-day moving average (MA) for XRP stands at $2.60, while the 200-day MA is at $2.00. A crossover from below can signal bullish momentum, while a drop below the 200-day MA may indicate a bearish outlook.
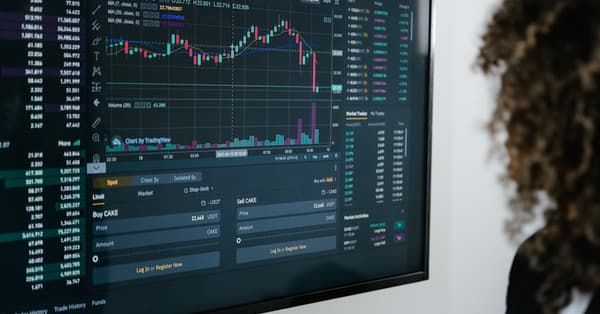
The Relative Strength Index (RSI) for XRP currently sits at 60, suggesting the asset is nearing overbought territory. Meanwhile, the Moving Average Convergence Divergence (MACD) ...
Tags:
Ready to Make Profitable Crypto Calls?
Check out our proven track record on the leaderboard
View Leaderboard →Related Posts
Beginner's Guide to Meme Coin Trading
Everything you need to know to start trading meme coins safely - from wallet setup to your first trade.
Is Bitcoin's Surge Igniting a Meme Coin Revival?
Bitcoin's latest bounce is stirring interest in meme coins again. Discover how whale activity could shape the market and what trends to watch.
Navigating Japan's New Crypto Tax: What Traders Should Know
Japan's new 20% crypto tax could change your trading game, especially with meme coins. Discover how this impacts traders across Asia.
Unlocking Crypto Trends: Meme Coins & ETFs in Q4 2023
Dive into the latest shifts in the crypto market with meme coins and ETF developments. Discover what these trends mean for your trading strategy.
Crypto Market Volatility: What You Need to Know Now
The crypto landscape is shifting fast. Discover why now is a pivotal moment for traders with insights into Bitcoin's plunge and meme coin dynamics.
Is Ripple Challenging JPMorgan? What Meme Coin Traders Need to Know
Discover how Ripple's rise is reshaping finance and what it means for meme coin traders. Don’t miss out on these insights for your next move!