Mastering Cardano: Trade Smart in the $0.43-$0.30 Zone
Cardano's price is in flux. Discover key strategies and insights to navigate the $0.43-$0.30 range and make informed trading decisions.
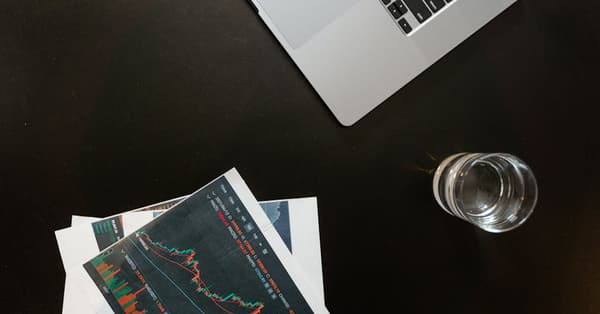
Cardano (ADA) has been a hot topic in the crypto world lately, particularly due to its recent price fluctuations. With increased volatility driven by whale activity and shifting market sentiment, you might be looking for some solid insights to guide your trading decisions.
Understanding ADA's price movements is crucial, whether you're in it for the short haul or playing the long game. In this article, we’ll dive into actionable trading strategies, in-depth market analysis, and essential insights to help you navigate the current price range.
We’ll cover ADA’s market dynamics, technical analysis, trading strategies, and a forward-looking outlook, equipping you with the tools you need to make informed choices.
The sentiment surrounding Cardano is one of cautious optimism right now. Social media buzz often spikes during price upswings, and community engagement can significantly influence trading volumes. Keeping an eye on these trends is essential for any professional crypto trader.
Whales, or those who hold substantial amounts of ADA, can dramatically sway market volatility. Recent transactions involving large holdings have led to notable price swings, making it clear just how much these players can dictate market conditions. As a trader, staying informed about whale movements can provide valuable insights.
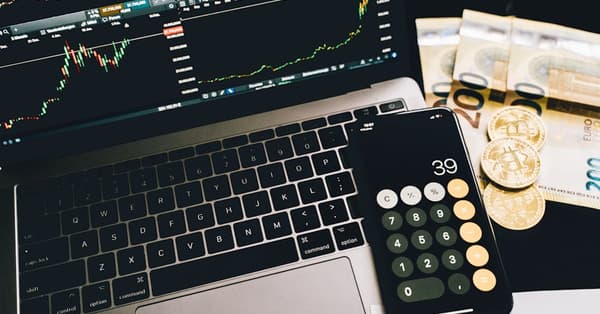
ADA’s trading volume has been on the move, showing a recent average increase of 35% compared to previous months. By understanding these volume trends, you can better gauge market strength and identify potential reversals.
🎯 KEY INSIGHT

Currently, Cardano's trading volume stands at $1.2 billion, exceeding its historical monthly average by 30%. This indicates a surge in market interest that you shouldn’t overlook.
ADA is currently testing a critical support level at $0.43, while resistance is forming just above $0.50. These levels are vital for you to monitor, as they can determine your entry and exit points in the market.

Key indicators like the MACD and RSI are crucial for your analysis. Right now, the RSI sits at 55, suggesting a slight upward momentum, while the MACD shows promising crossover potential. Keeping an eye on these indicators can help you make better trading decisions.
As a trader, prepare for potential price scenarios ranging from $0.30 to $0.50. Historical data suggests that these levels could serve as key touchpoints in the near future. [link: historical analysis]
Tags:
Ready to Make Profitable Crypto Calls?
Check out our proven track record on the leaderboard
View Leaderboard →Related Posts
Understanding Telegram Trading Signals
How to interpret trading signals, understand call formats, and execute trades effectively.
Why Asian Traders Are Buying Bitcoin While Americans Sell
Discover why Asian traders are accumulating Bitcoin amidst a downturn. This article dives into market trends and trading strategies you won't want to miss.
Can XRP Outshine Ethereum? Traders Weigh In on ETF Trends
XRP's recent surge to $2.12 has traders buzzing. Is it ready to take on Ethereum? Let's explore the ETF hype and what it means for your portfolio.
Navigating Monero's Downtrend: Strategies for Traders
Dive into the latest market analysis of Monero (XMR) and explore effective strategies to navigate its recent downtrend. Don't miss out on key insights!
XRP Price Prediction: Can It Break the $2.50 Barrier?
Join the discussion as we analyze XRP's price action and explore strategies for trading the critical $2.50 resistance level. Will it hold or break?
XRP Price Prediction: Key Insights for Navigating Resistance
Struggling to break through the $2.50 level? Dive into our analysis for actionable insights to strengthen your trading strategy and navigate XRP’s challenges.